
Open or combine
Parquet, CSV, Excel, JSON, R, Arrow and GIS layers inside one workspace.
Open huge files, join them with SQL, catch quality issues and turn coordinates into maps. A local analysis workstation for Windows, powered by DuckDB.
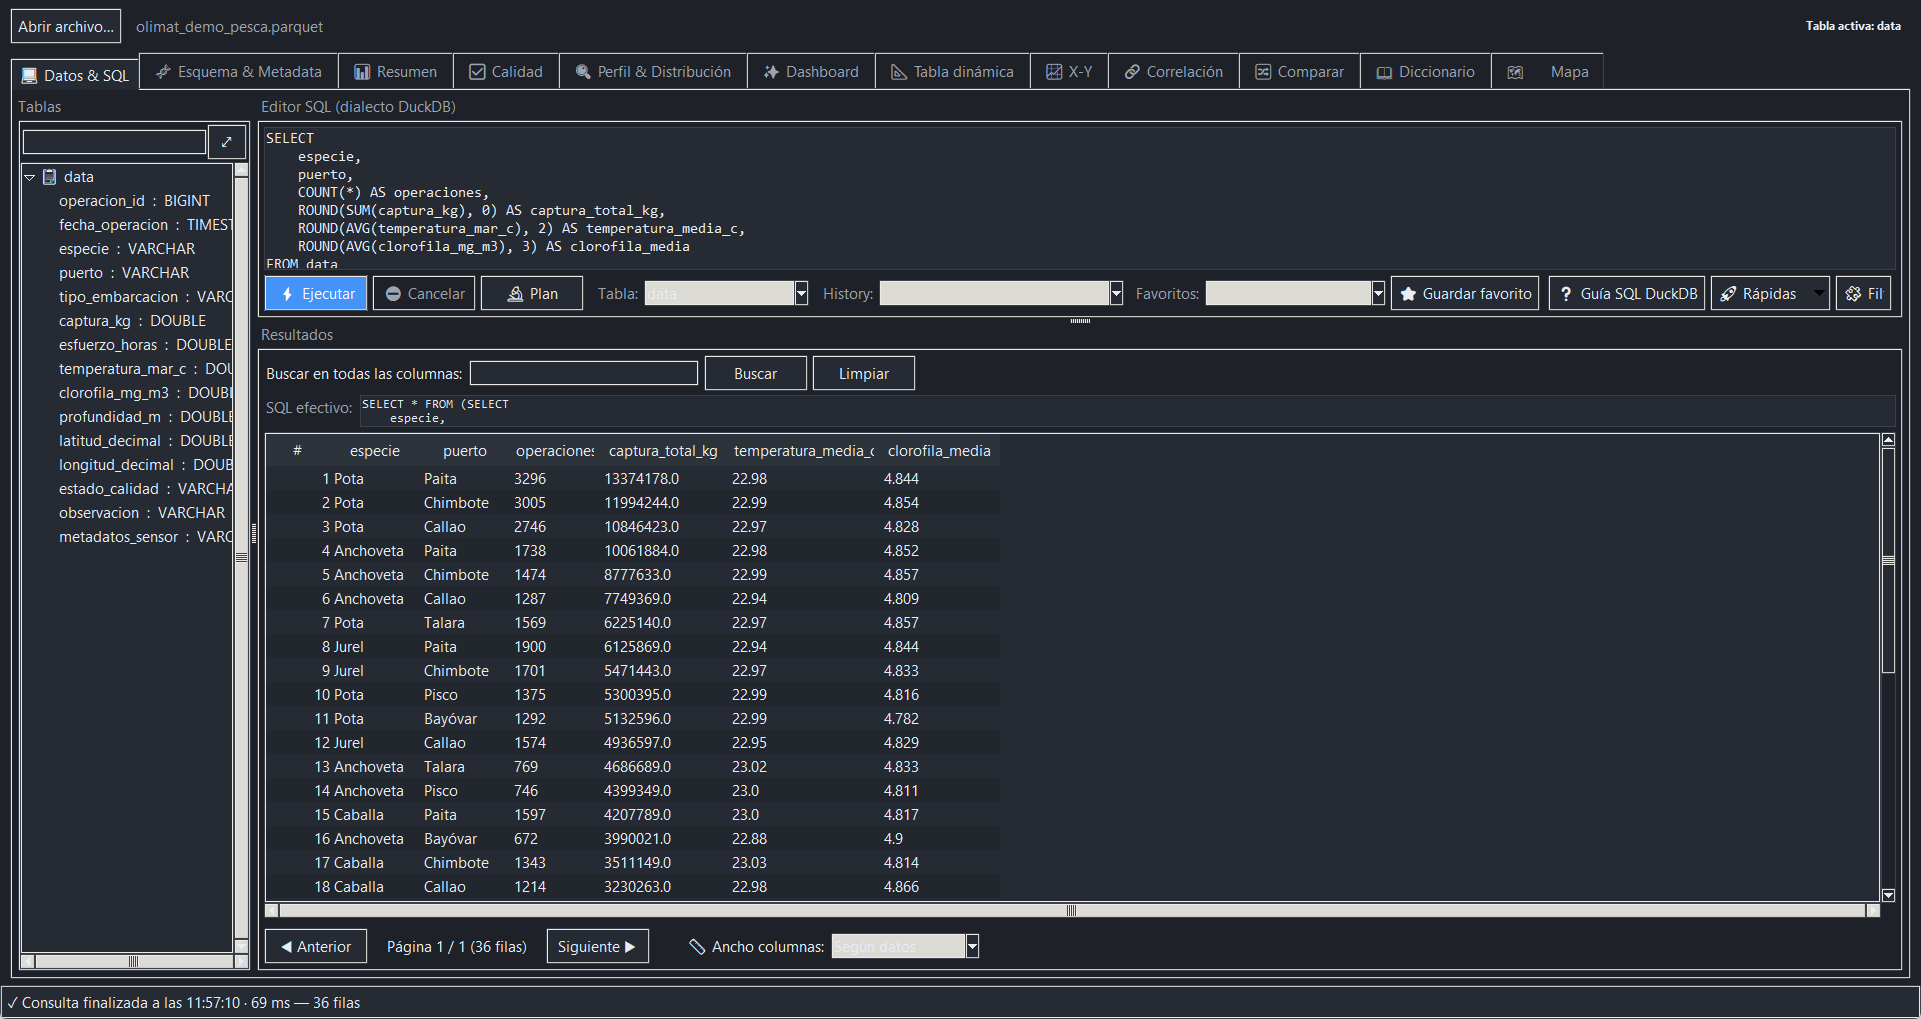
No database to install, no server to configure. The flow is built to investigate first and formalize the analysis later.
Parquet, CSV, Excel, JSON, R, Arrow and GIS layers inside one workspace.
Schema, types, nulls, distributions, outliers and nested structure.
Visual filters, DuckDB SQL, JOINs, pivot tables, correlation and maps.
Export results to Parquet, Excel, CSV, JSON, GeoJSON, Arrow or SQL.
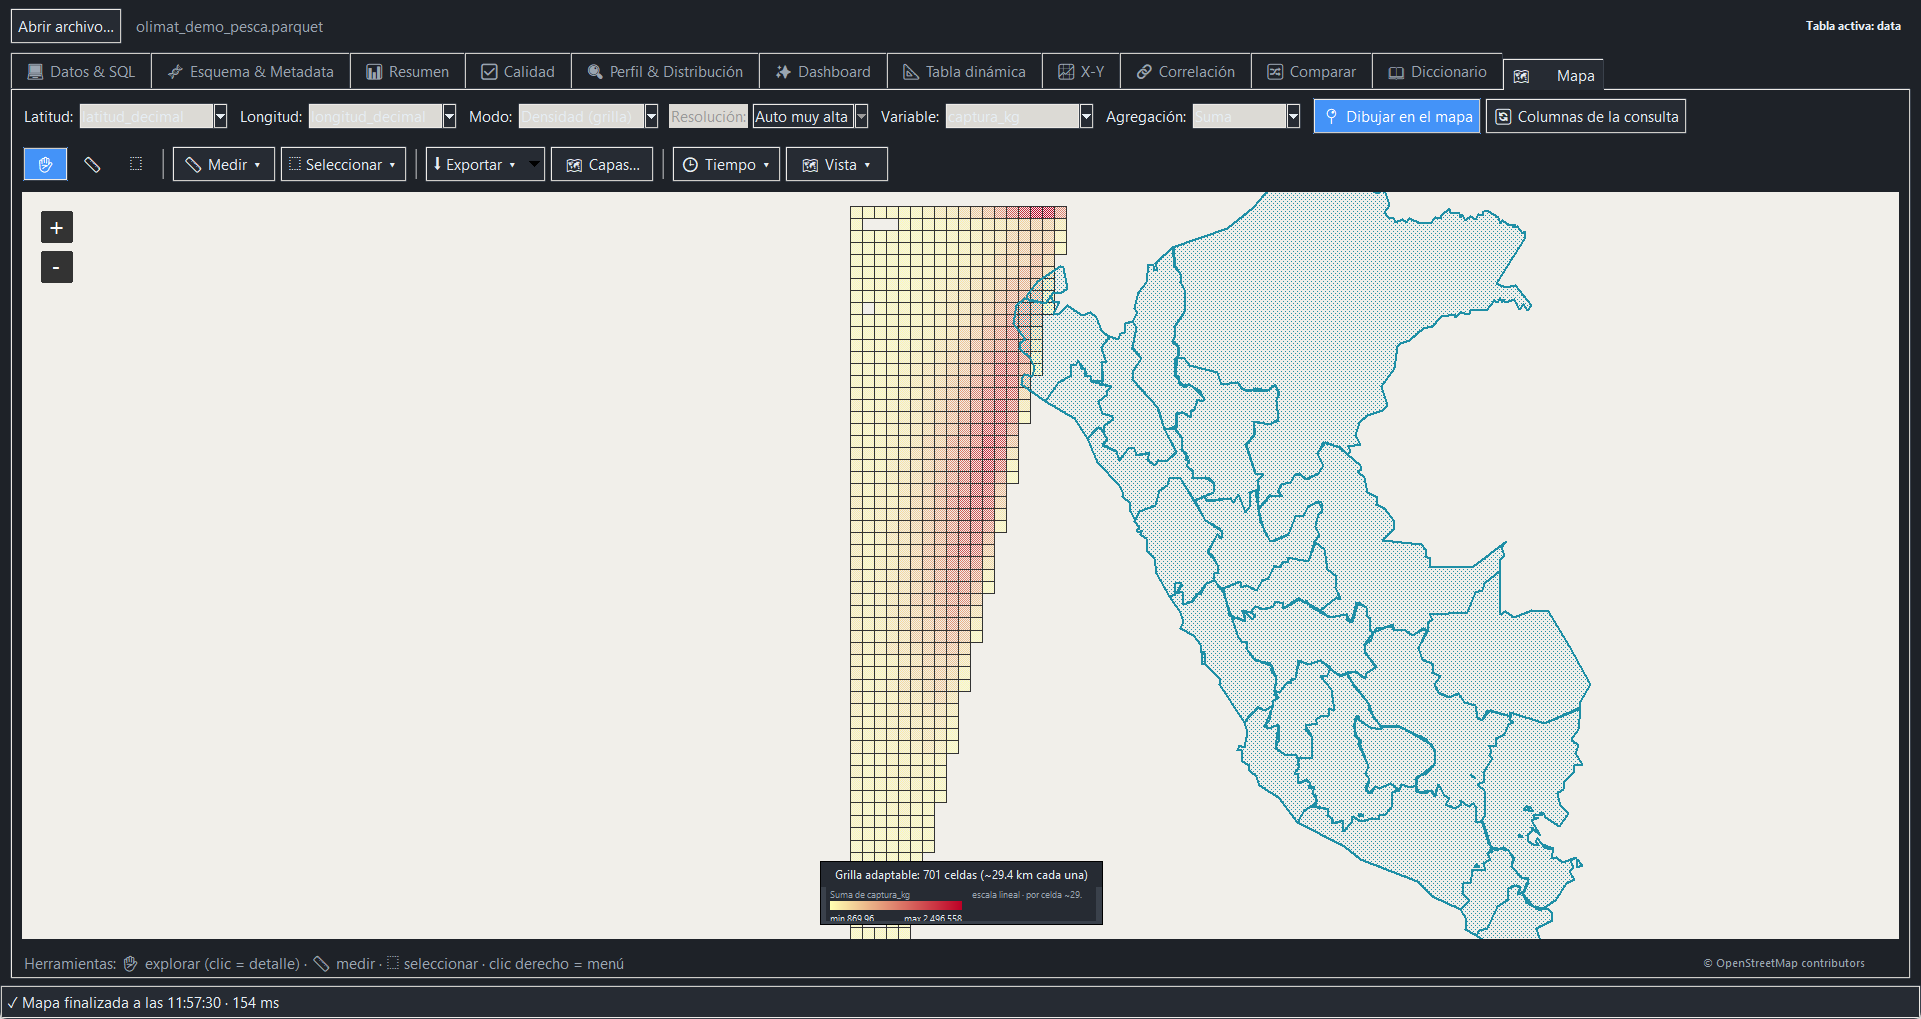 701-cell grid weighted by catch sum
Detect coordinates, summarize millions of points into a readable grid and add reference layers without switching tools.
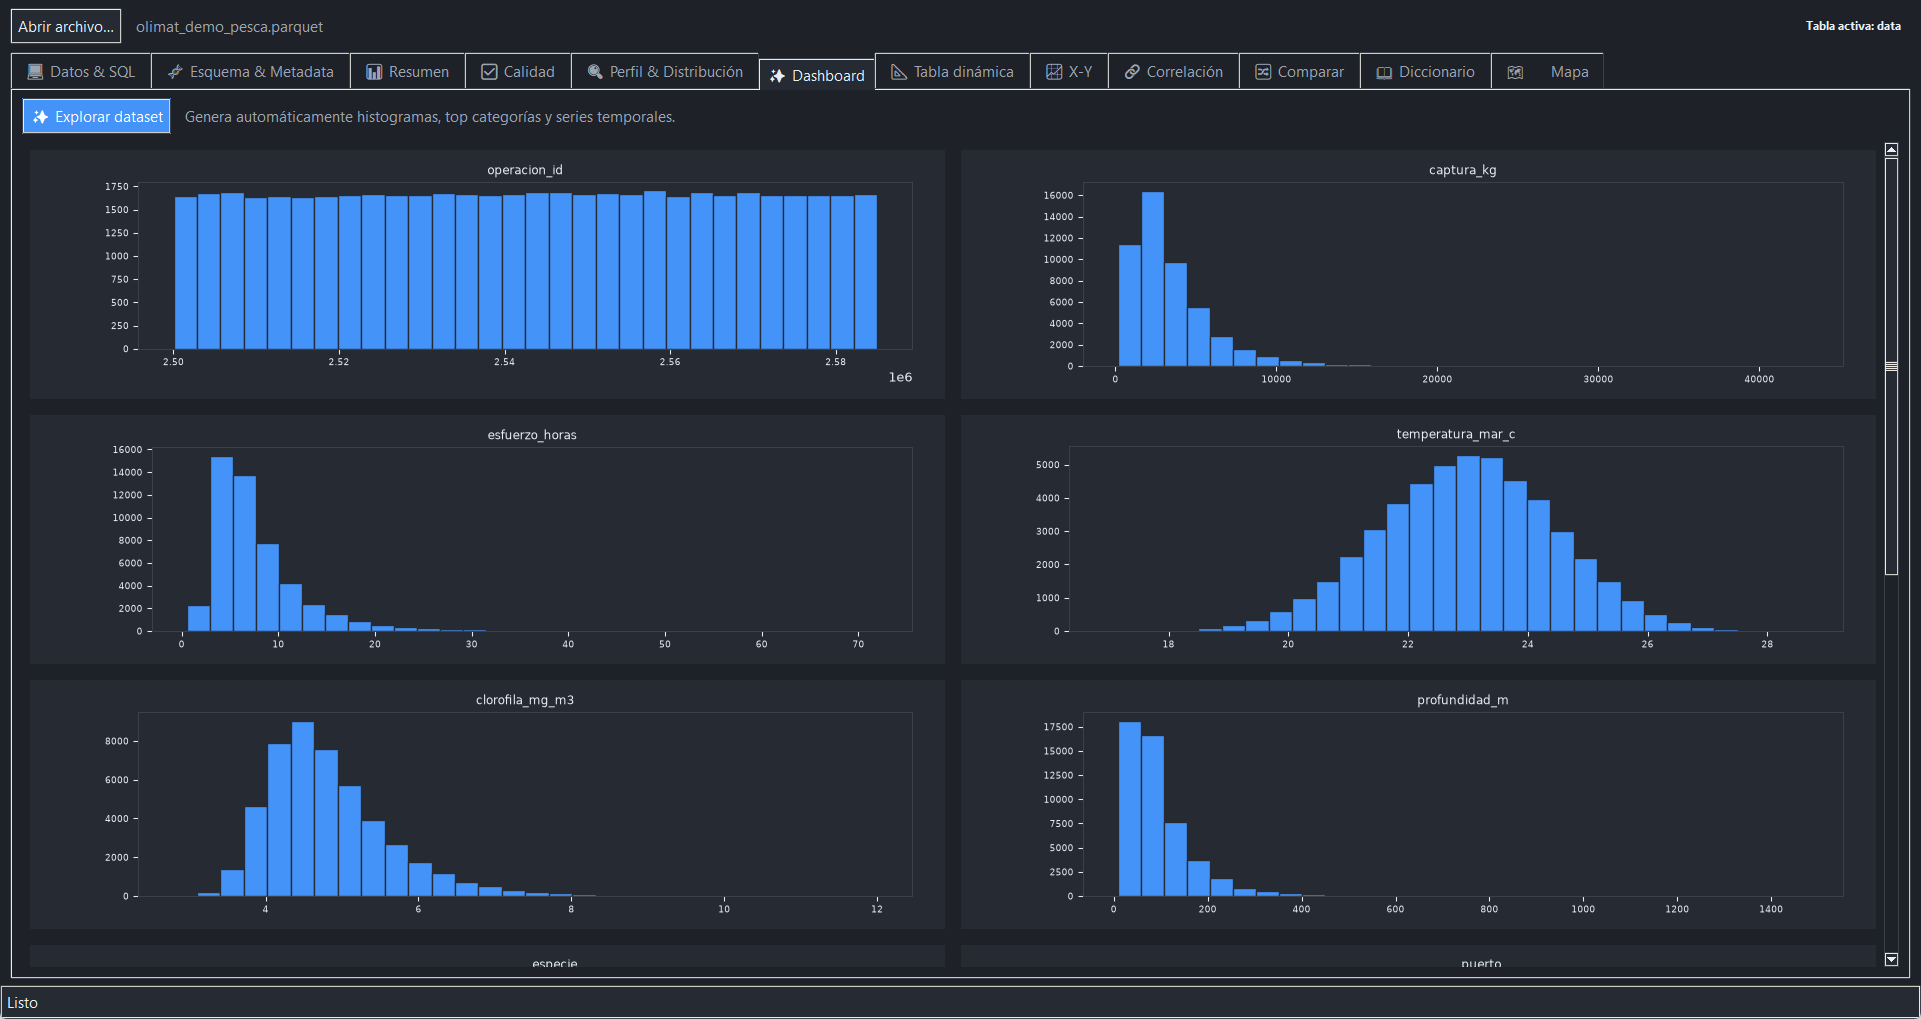 Automatic exploration without writing SQL
Generate histograms, top categories and time series to orient the analysis before writing a single query.
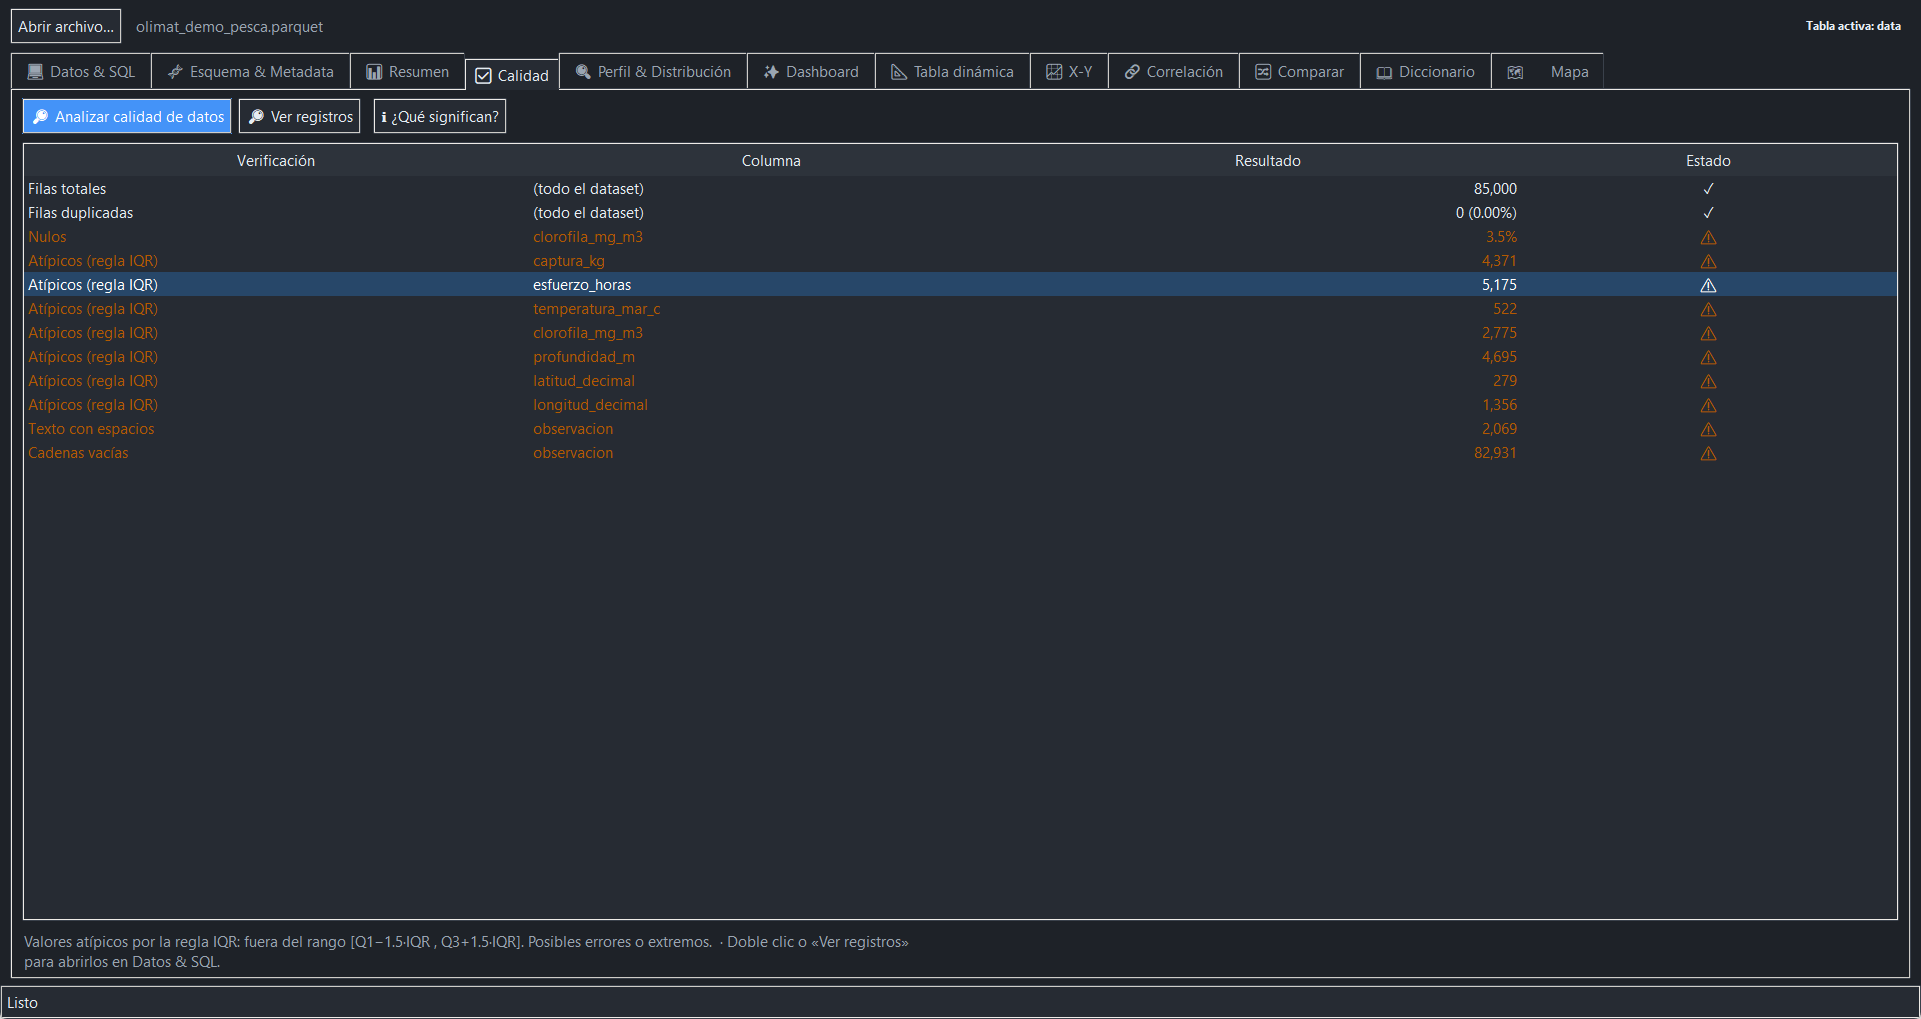 Every warning explains itself and opens the affected rows
Before presenting results, review anomalies in context and jump from the warning straight to the affected records.
Twelve modules sharing the same dataset, the same query and the same session. Here for Parquet? See the Parquet viewer for Windows.
Paged grid, visual filters and reproducible DuckDB queries.
02Columns, types, metadata and table explorer.
03Rows, cardinality and type-aware summaries.
04Nulls, duplicates, mixed types, outliers and saved rules.
05Percentiles, top values, histograms and HTML report.
06Automatic distributions, categories and time series.
07Rows, columns, measure and aggregation.
08Scatter, density, groups and controlled samples.
09Pearson, Spearman, matrix and pair detail.
10Differences in structure, rows, types and nulls.
11Description, unit, domain and notes per column.
12Grids, layers, selection, measures and GeoJSON/PNG.
Version 4.60 improves how the density map reads and strengthens the integrity of aggregations across the analysis.
Choose whether the map colour means the same across the whole dataset —comparable between screenshots— or rescales to what is visible for maximum local contrast.
Click a cell and records are sorted by the variable you are mapping, with the aggregated value in the status bar: you instantly see why an area stands out.
Fixed handling of non-numeric values (NaN) in maps, pivot tables, charts and profiles: no more empty or skewed results.
Checking for new versions is opt-in: it only runs if you allow it, and the app works the same, even offline.
Its value is opening, understanding, joining and delivering data quickly before moving to a specialized platform.
| Need | OliMat | Spreadsheet | DB client | Dedicated GIS |
|---|---|---|---|---|
| Open local Parquet without importing | Yes | Limited | Depends | Depends |
| JOIN across Parquet, CSV and Excel | Yes | Limited | Yes | Partial |
| Guided profiling and quality | Yes | Manual | Partial | Partial |
| Weighted spatial grid | Yes | — | — | Yes |
| Read R RDS/RData without installing R | Yes | — | — | Rare |
| Shareable one-click profile report | Yes | Manual | Partial | — |
No. You can open, sort, filter, profile, map and export visually — the visual filter even writes and shows the SQL so you learn as you go. SQL becomes useful for JOINs and repeatable analysis.
DuckDB queries files without loading them fully into memory and the grid paginates results. The practical limit depends on disk, query and available RAM.
Analysis always works offline. On the map, visited areas are cached automatically and reused without a connection; you can also overlay local GeoJSON and Shapefile layers.
Yes, even lists containing many tables: the app shows a catalog, converts only the tables you pick, and you query them with SQL. No R installation needed.
CSV exported as Latin-1/Windows-1252 or UTF-16 is detected and opened automatically with correct characters.
Yes. The complete application is free for personal, academic, institutional and commercial use under the included license. Donations are voluntary.
Download OliMat Data Explorer, open your first file and move from inspection to analysis with zero infrastructure.