01 · Work centerData & SQL
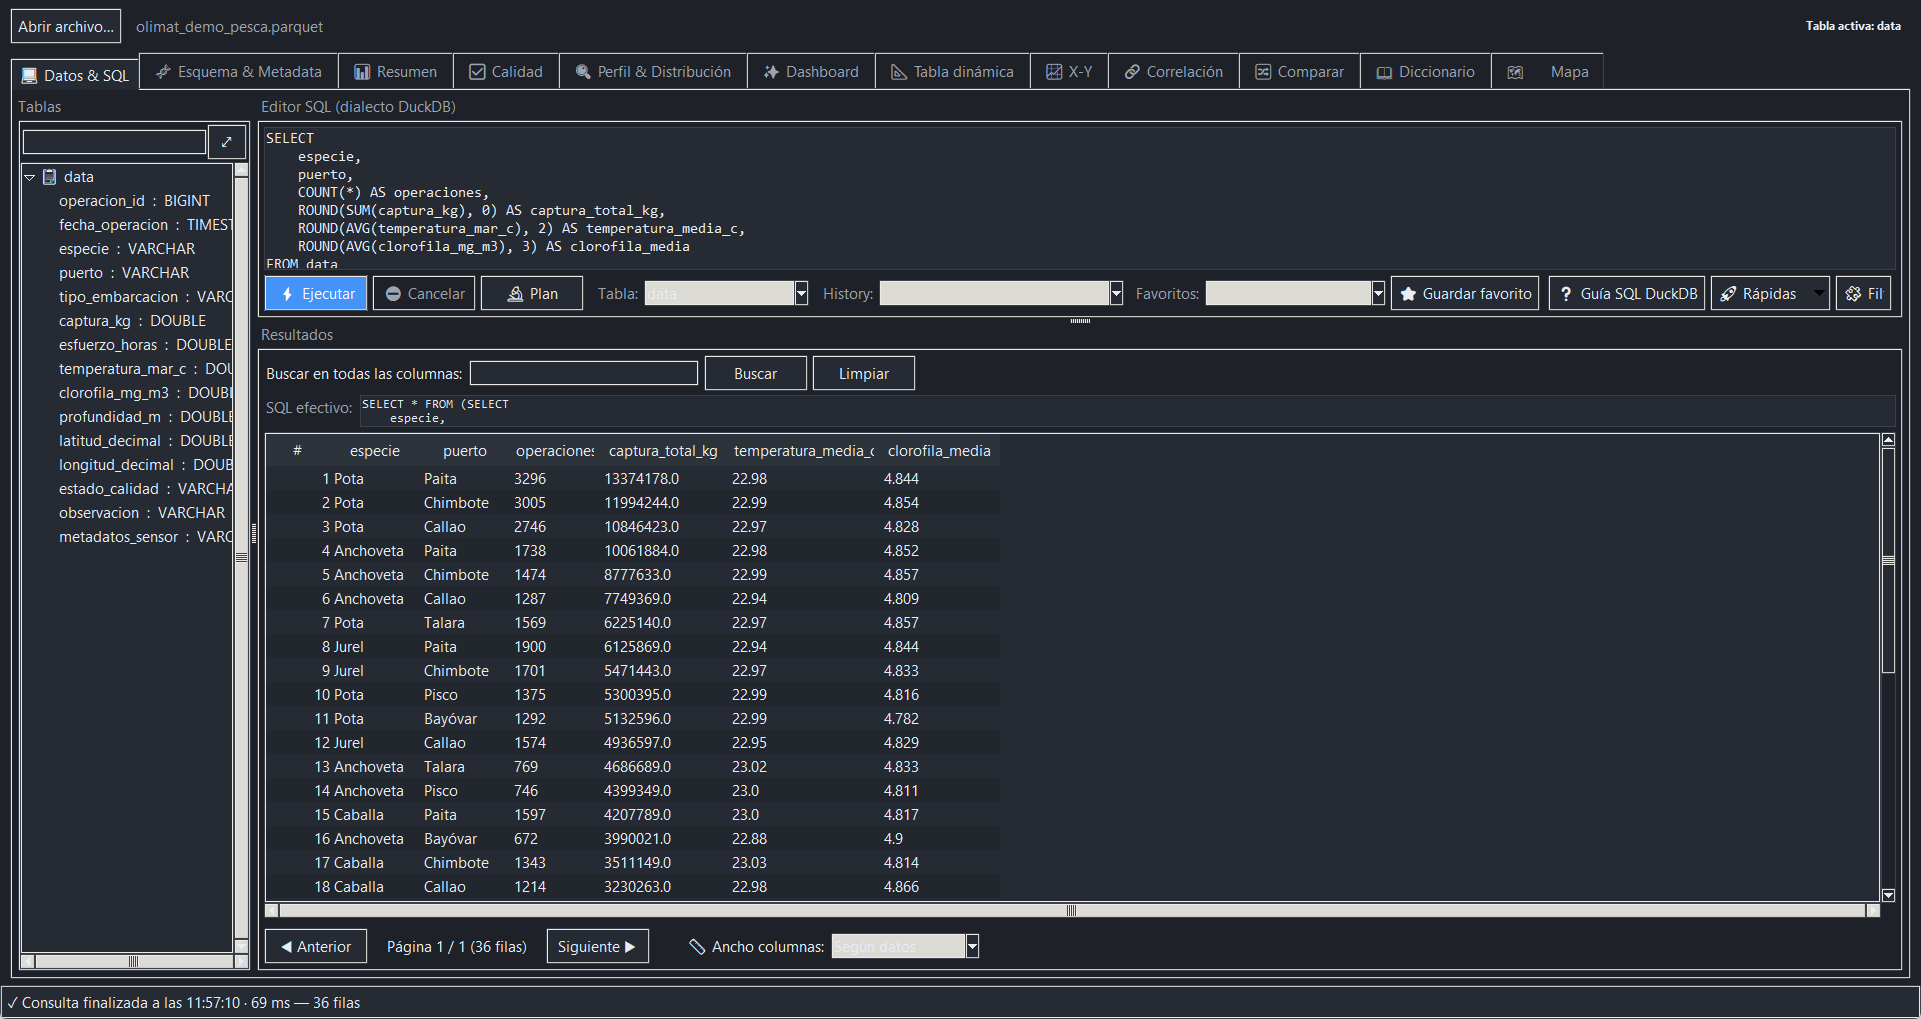
Inspect rows, filter with clicks or write DuckDB queries across one or more tables.
- Paged grid, search, sort and visual filter over the dataset.
- JOINs, aggregations, history, favorites, templates and generated SQL.
- EXPLAIN ANALYZE, cancellation, TSV, Markdown and INSERT copying.
How to use Data & SQL →
02 · StructureSchema
Understand each table's shape before analyzing it.
- Columns, DuckDB types, order, size and metadata.
- Filterable tree; copy name, generate SELECT, rename or activate.
- Review conversions and heterogeneous source structures.
How to review schema →
03 · SummaryStatistics
Get a numeric overview of the table without coding.
- Rows, columns, estimated memory, minima, maxima and averages.
- Counts, cardinality and type-appropriate metrics.
- Starting point for choosing columns to profile.
How to read the summary →
04 · TrustQuality
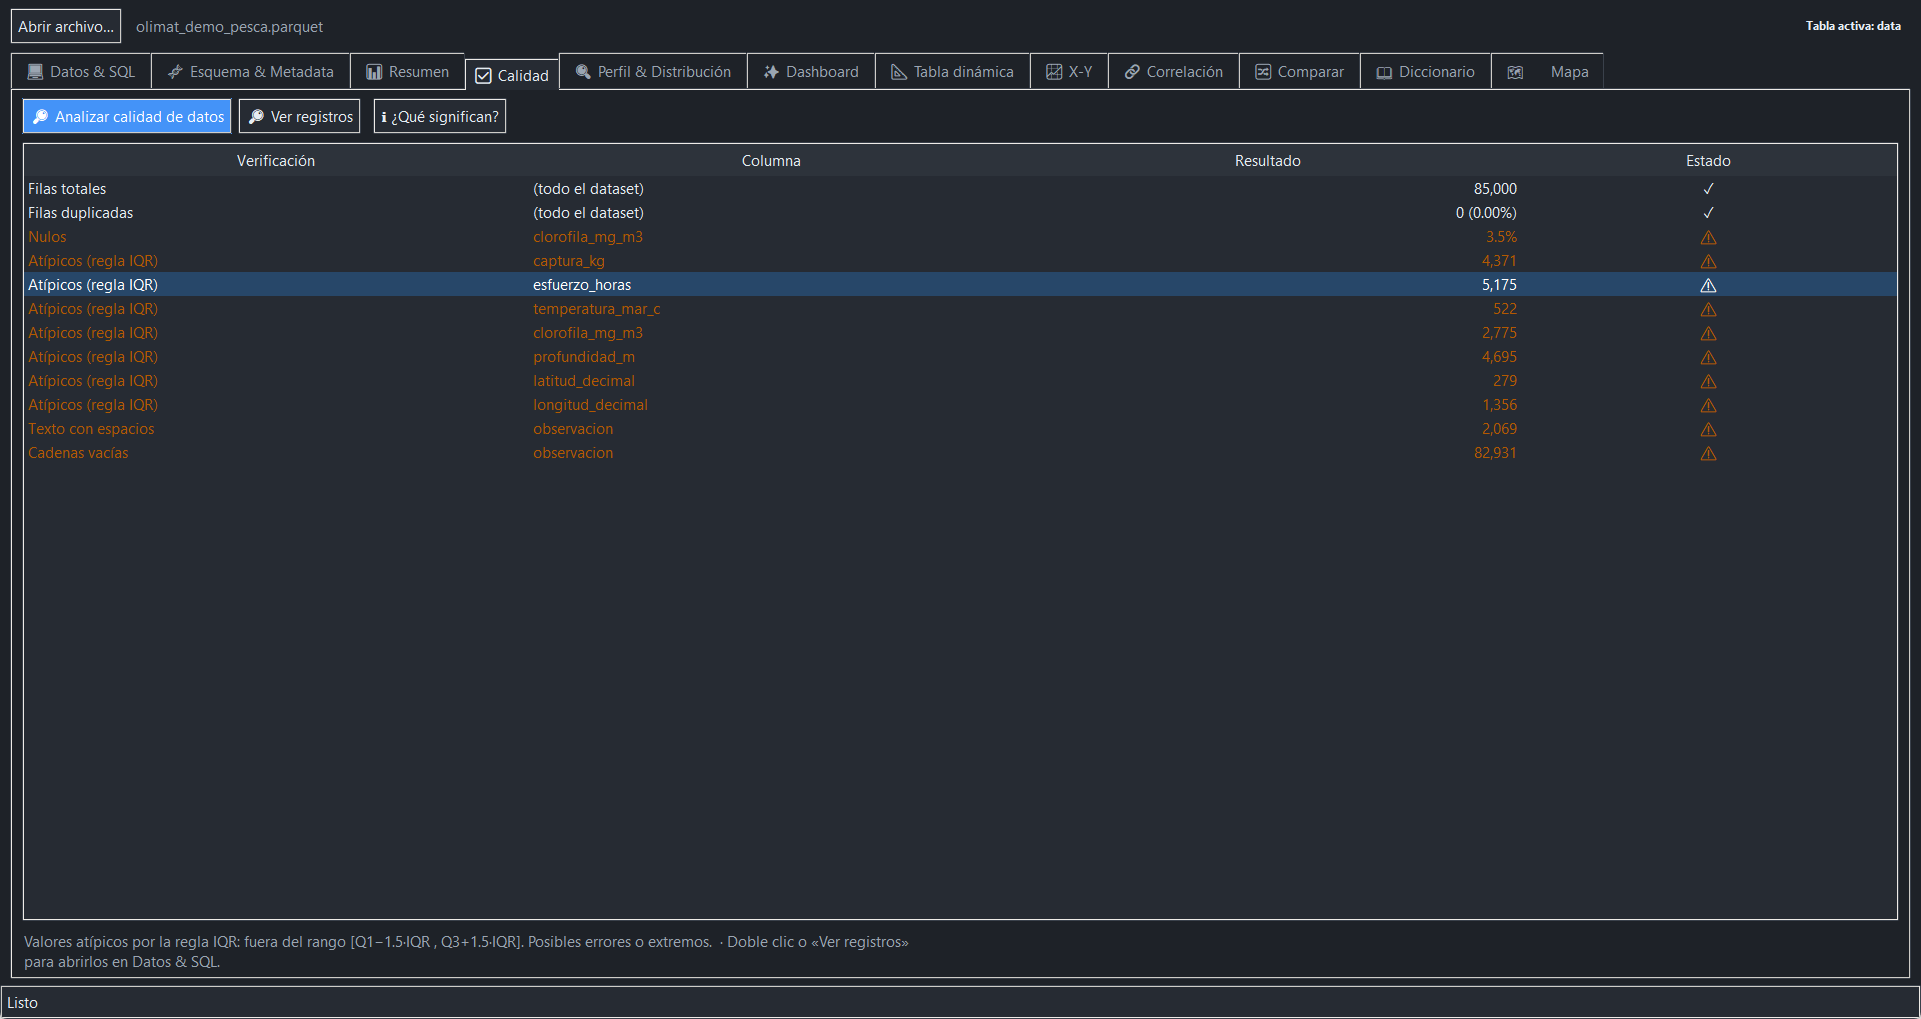
Detect anomalies and jump from a warning to the records involved.
- Nulls, duplicates, NaN, empties, constants and whitespace.
- Mixed types, IQR outliers and impossible coordinates.
- Saved rules: unique, range, pattern, list and length.
How to validate data →
05 · UnderstandingProfile
Explain one column or generate a profile for the whole dataset.
- Composition, nulls, uniques, percentiles, top values and histogram.
- Cell viewer for nested JSON, lists and structs.
- Self-contained HTML report to share or archive.
How to create a profile →
06 · First readingDashboard
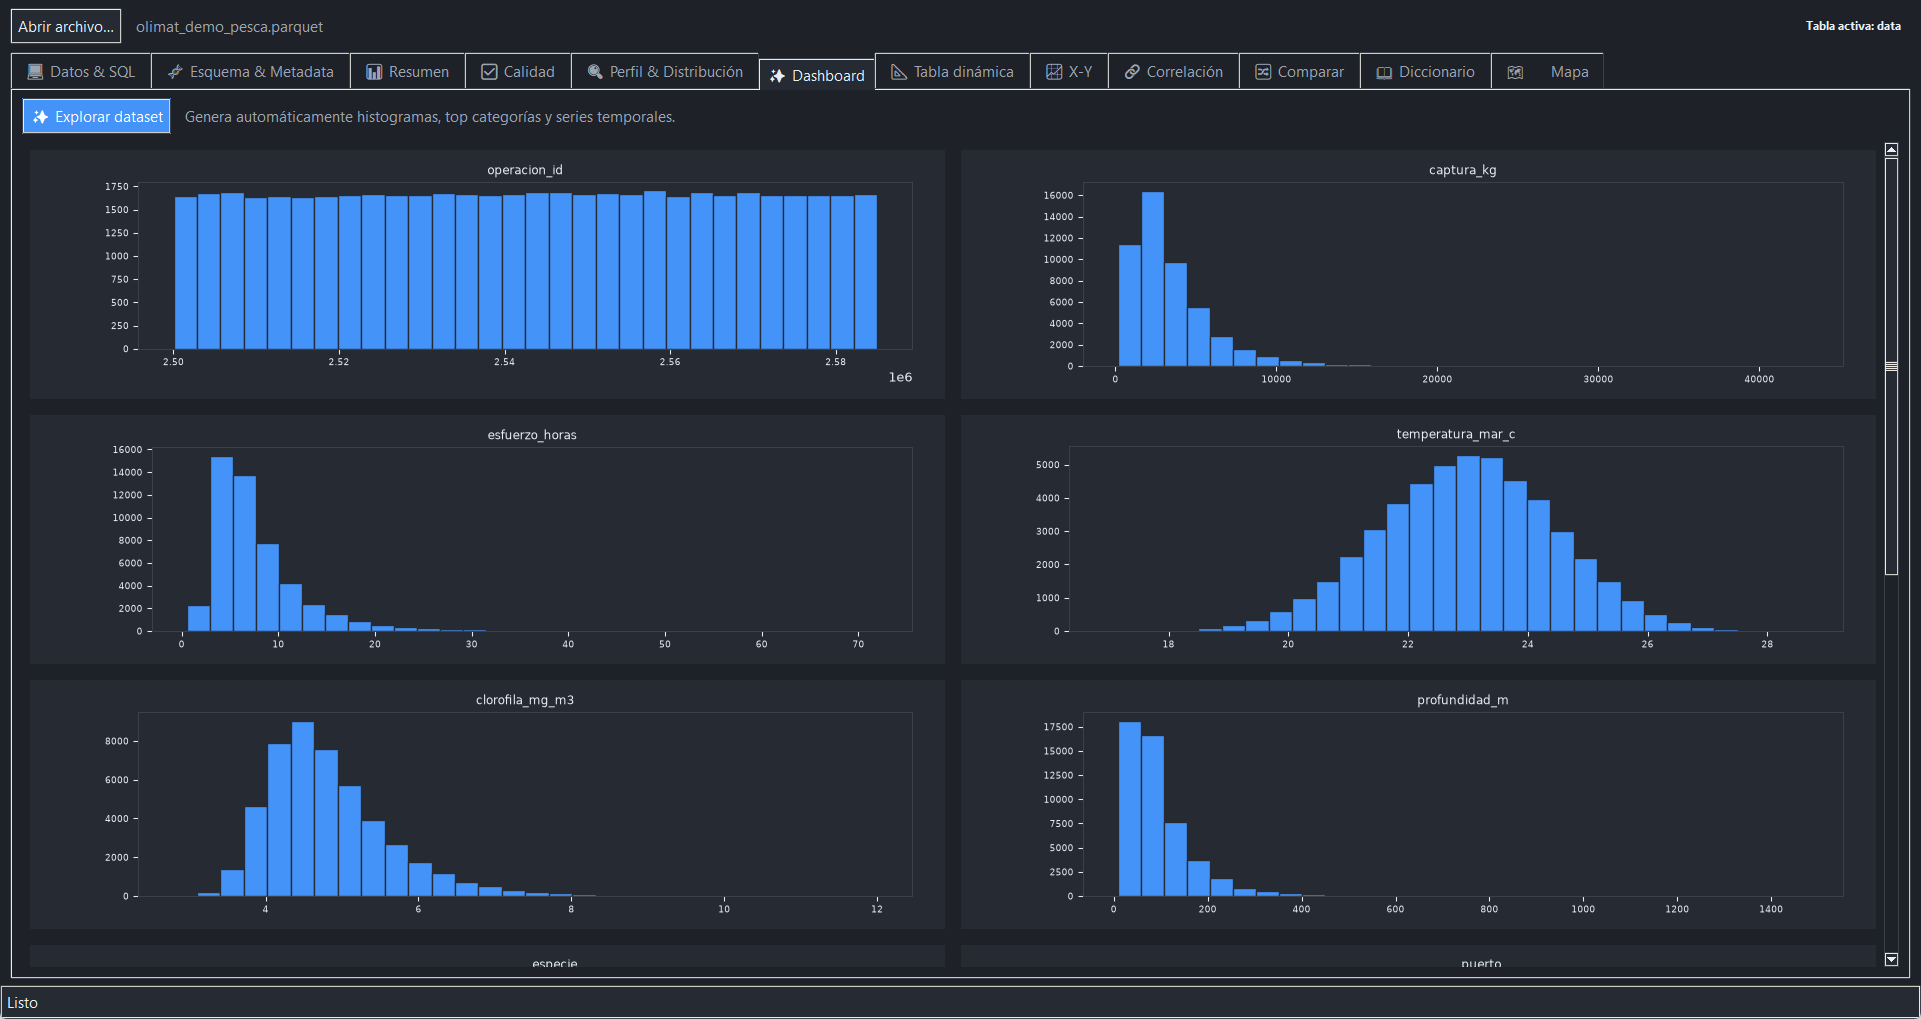
Automatically builds useful views based on column types.
- Numeric distributions, top categories and time series.
- Visual summary without configuring an external dashboard.
- Bridge to profiling, filters and reproducible queries.
How to use the dashboard →
07 · Cross summaryPivot
Build a pivot table with rows, columns, measure and aggregation.
- Sum, average, count, minimum and maximum.
- Categories and periods on executive-friendly axes.
- Exportable result usable as another query's input.
How to build a pivot →
08 · VisualizationX-Y Chart
Explore relationships, groups and distributions with controlled samples.
- X/Y axes, color or group and chart-type selection.
- Scatter, density and distribution views by data type.
- Sampling control for smooth work on large tables.
How to create a chart →
09 · RelationshipsCorrelation
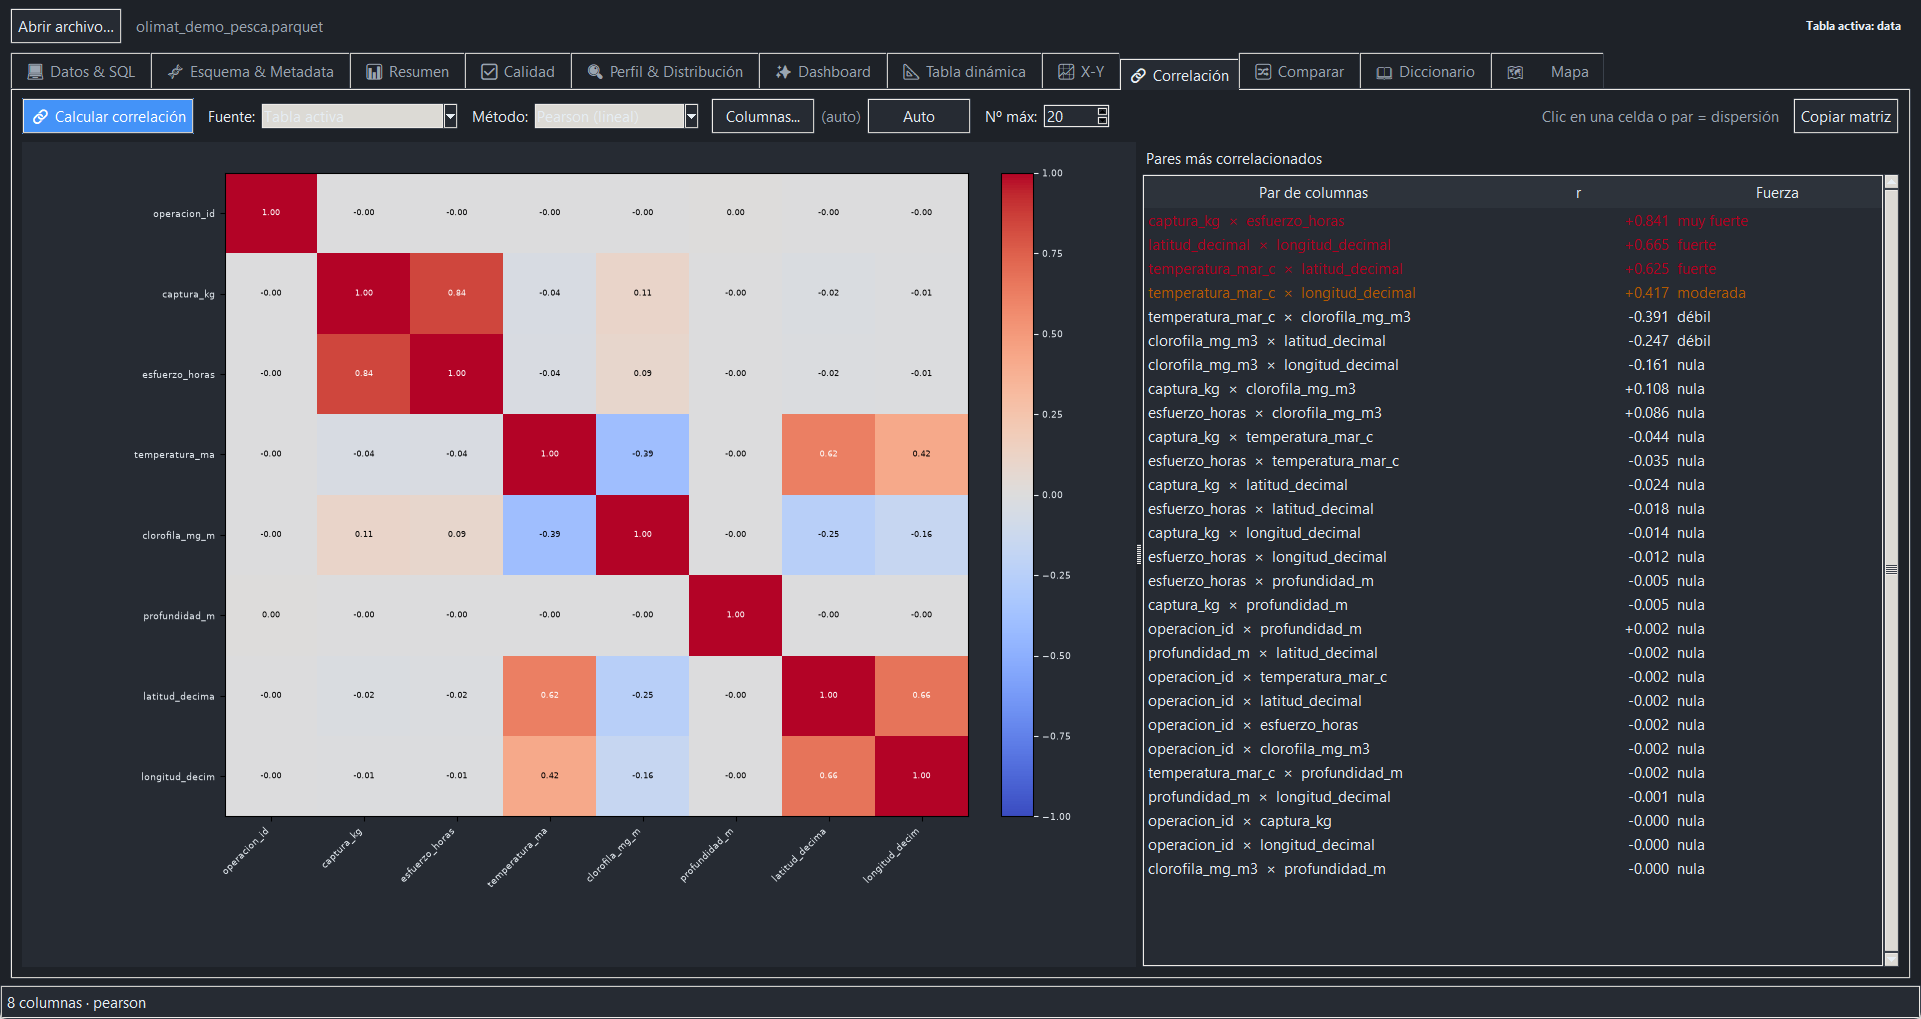
Prioritize related numeric pairs and open their visual detail.
- Pearson for linear relationships and Spearman for ranks.
- Matrix, ranked pairs and scatter detail.
- Column limit for wide datasets.
How to interpret correlations →
10 · AuditCompare
Contrast two tables or versions before accepting a delivery.
- Differences in columns, types, rows and nulls.
- Fast reading of structural and volume changes.
- Pairs with JOIN and ANTI JOIN for key-level detail.
How to compare datasets →
11 · GovernanceDictionary
Document every variable where it is analyzed.
- Description, unit, domain and notes by column.
- Editable and exportable metadata.
- Persistence inside the portable workspace.
How to document columns →
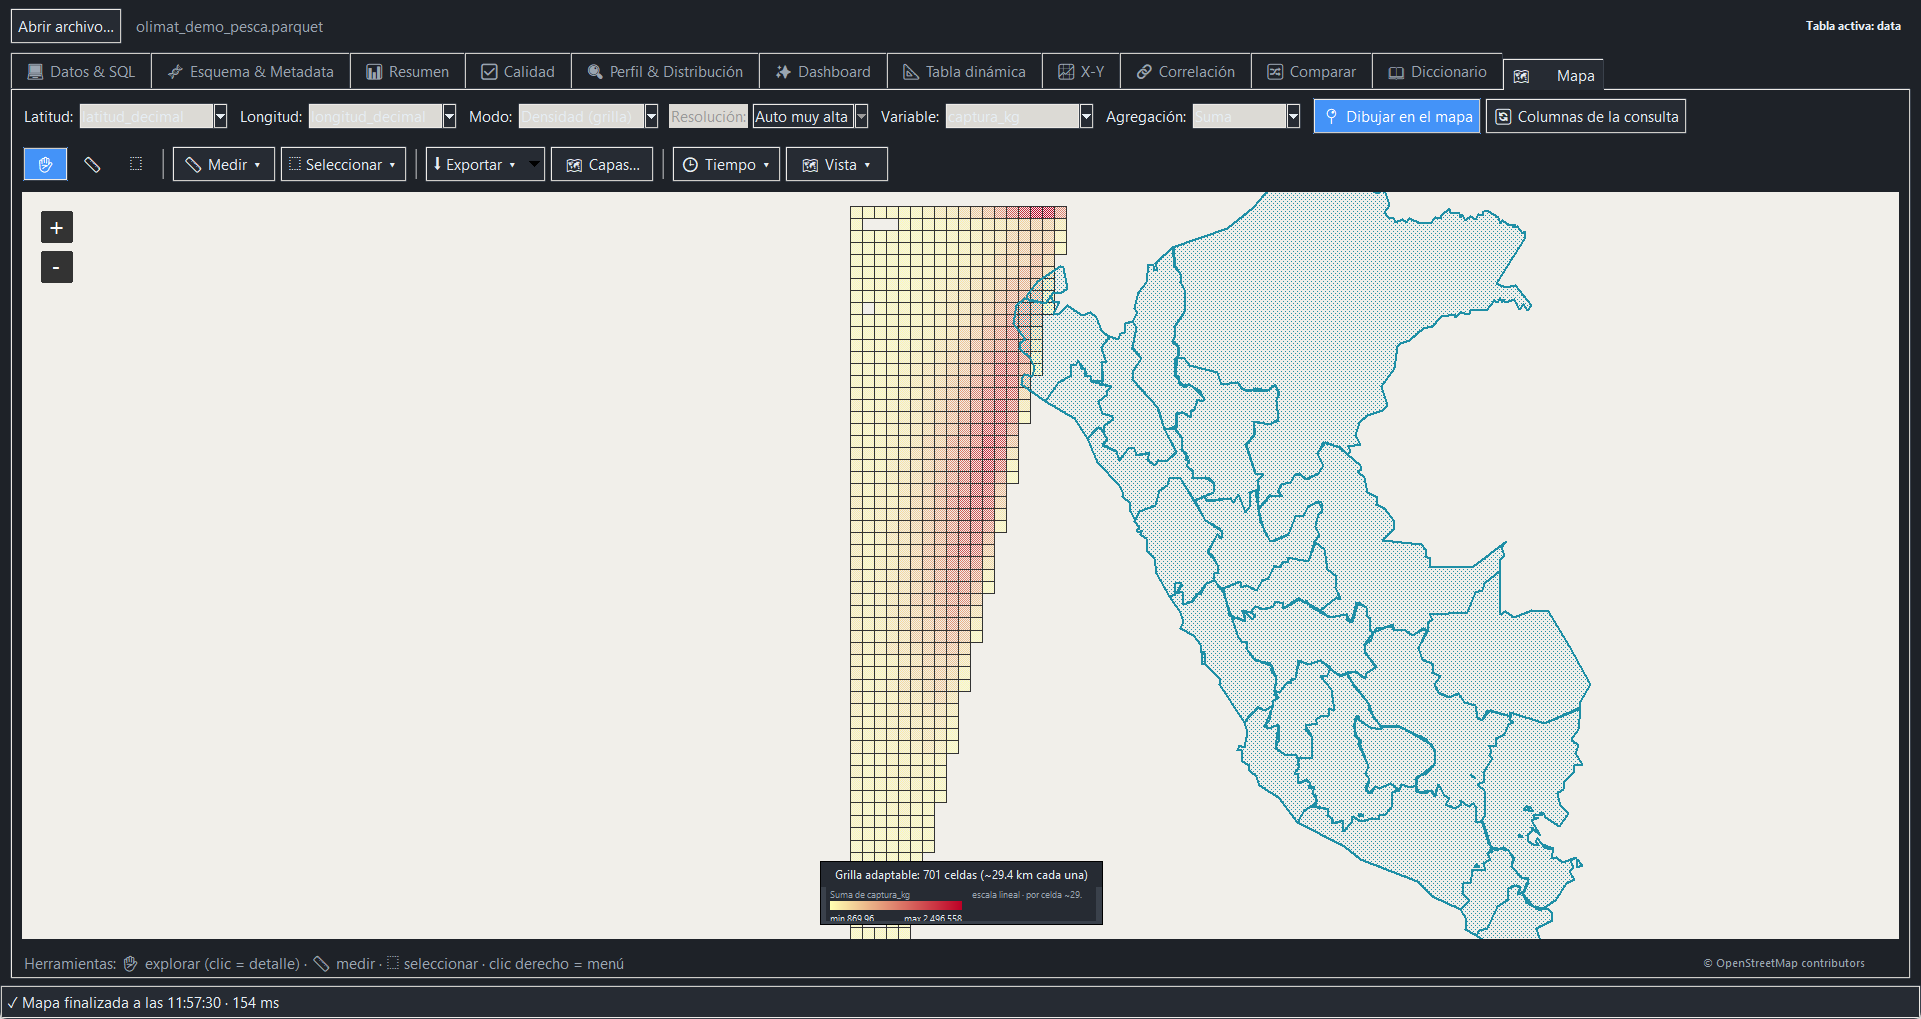
12 · GeospatialMap
Visualize massive coordinates and connect geographic selection to SQL.
- Points, adaptive or kilometre grids and numeric weighting.
- Local layers, time range, measurement and spatial selection.
- Inside/outside filters, GeoJSON and PNG with legend and scale.
How to create and filter a map →